In the past, I made an app that used RStudio’s Shiny platform to plot network graphs with RGraphviz. This worked, and gave some nice results, but when I found out about cytoscape.js, I really wanted to try that out.
The app is designed to plot tumblr reblogs, so it has a tree structure, but simply plotting things as a tree is not very space efficient (as in, the visualization takes up too much space). Therefore, using different types of layouts can really help.
In my first app with graphviz https://colindiesh.shinyapps.io/tumblrgraph, there are several built-in graph layouts including “neato” “twopi”, “circo”, and “dot”
I made all of these available for users to try in the Shiny app. The names of the layouts don’t lend much to their behavior, but they are built-in functions in Graphviz. There are both “tree” and “force-directed” style graph views. As I mentioned, the “tree” style view make a lot of sense for the tumblr reblogs, but the force directed graphs are also a lot more compact, so offering both styles is useful.
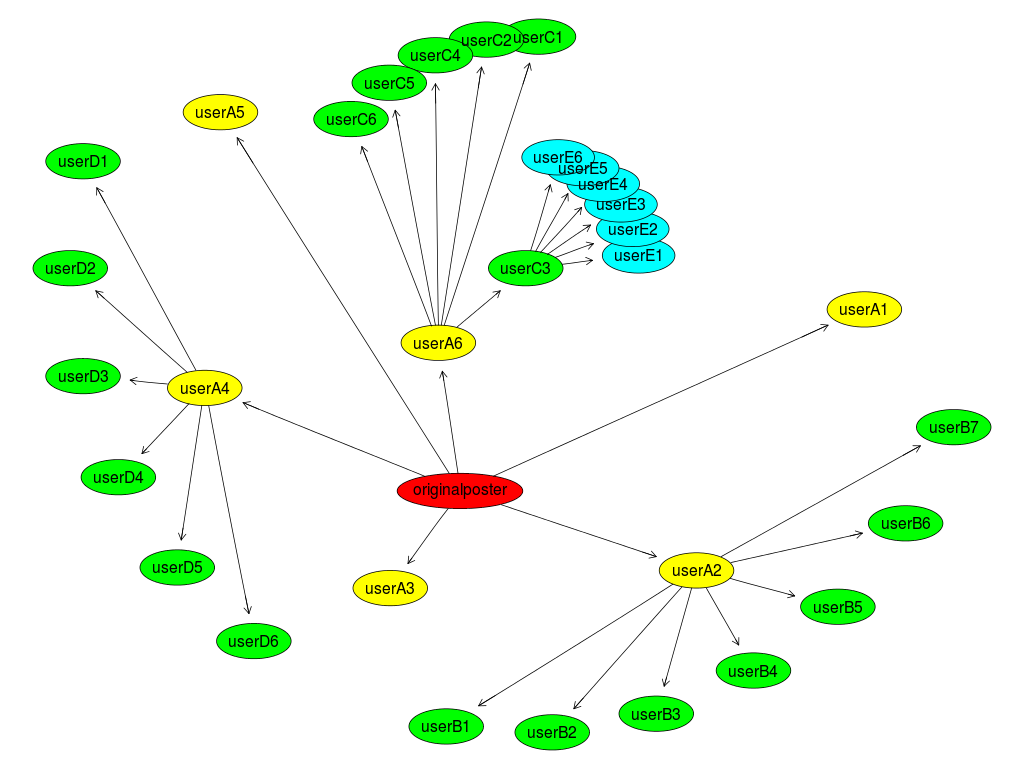
Figure 1. My default example graph from graphviz using the twopi layout.
I wanted to replicate all the features that I had in the Graphviz app in Cytoscape.js. Here is the breakdown of the basic components that needed replicating:
-
Build the “graph” representation of reblogs in memory
-
Add user forms and configurability
-
Add color for distance from root using a breadth first search
-
Draw the graph
As I went along, I was happy to learn that the concepts mapped very easily to javascript and cytoscape.js. The implementations are a little different, but it worked out very nicely.
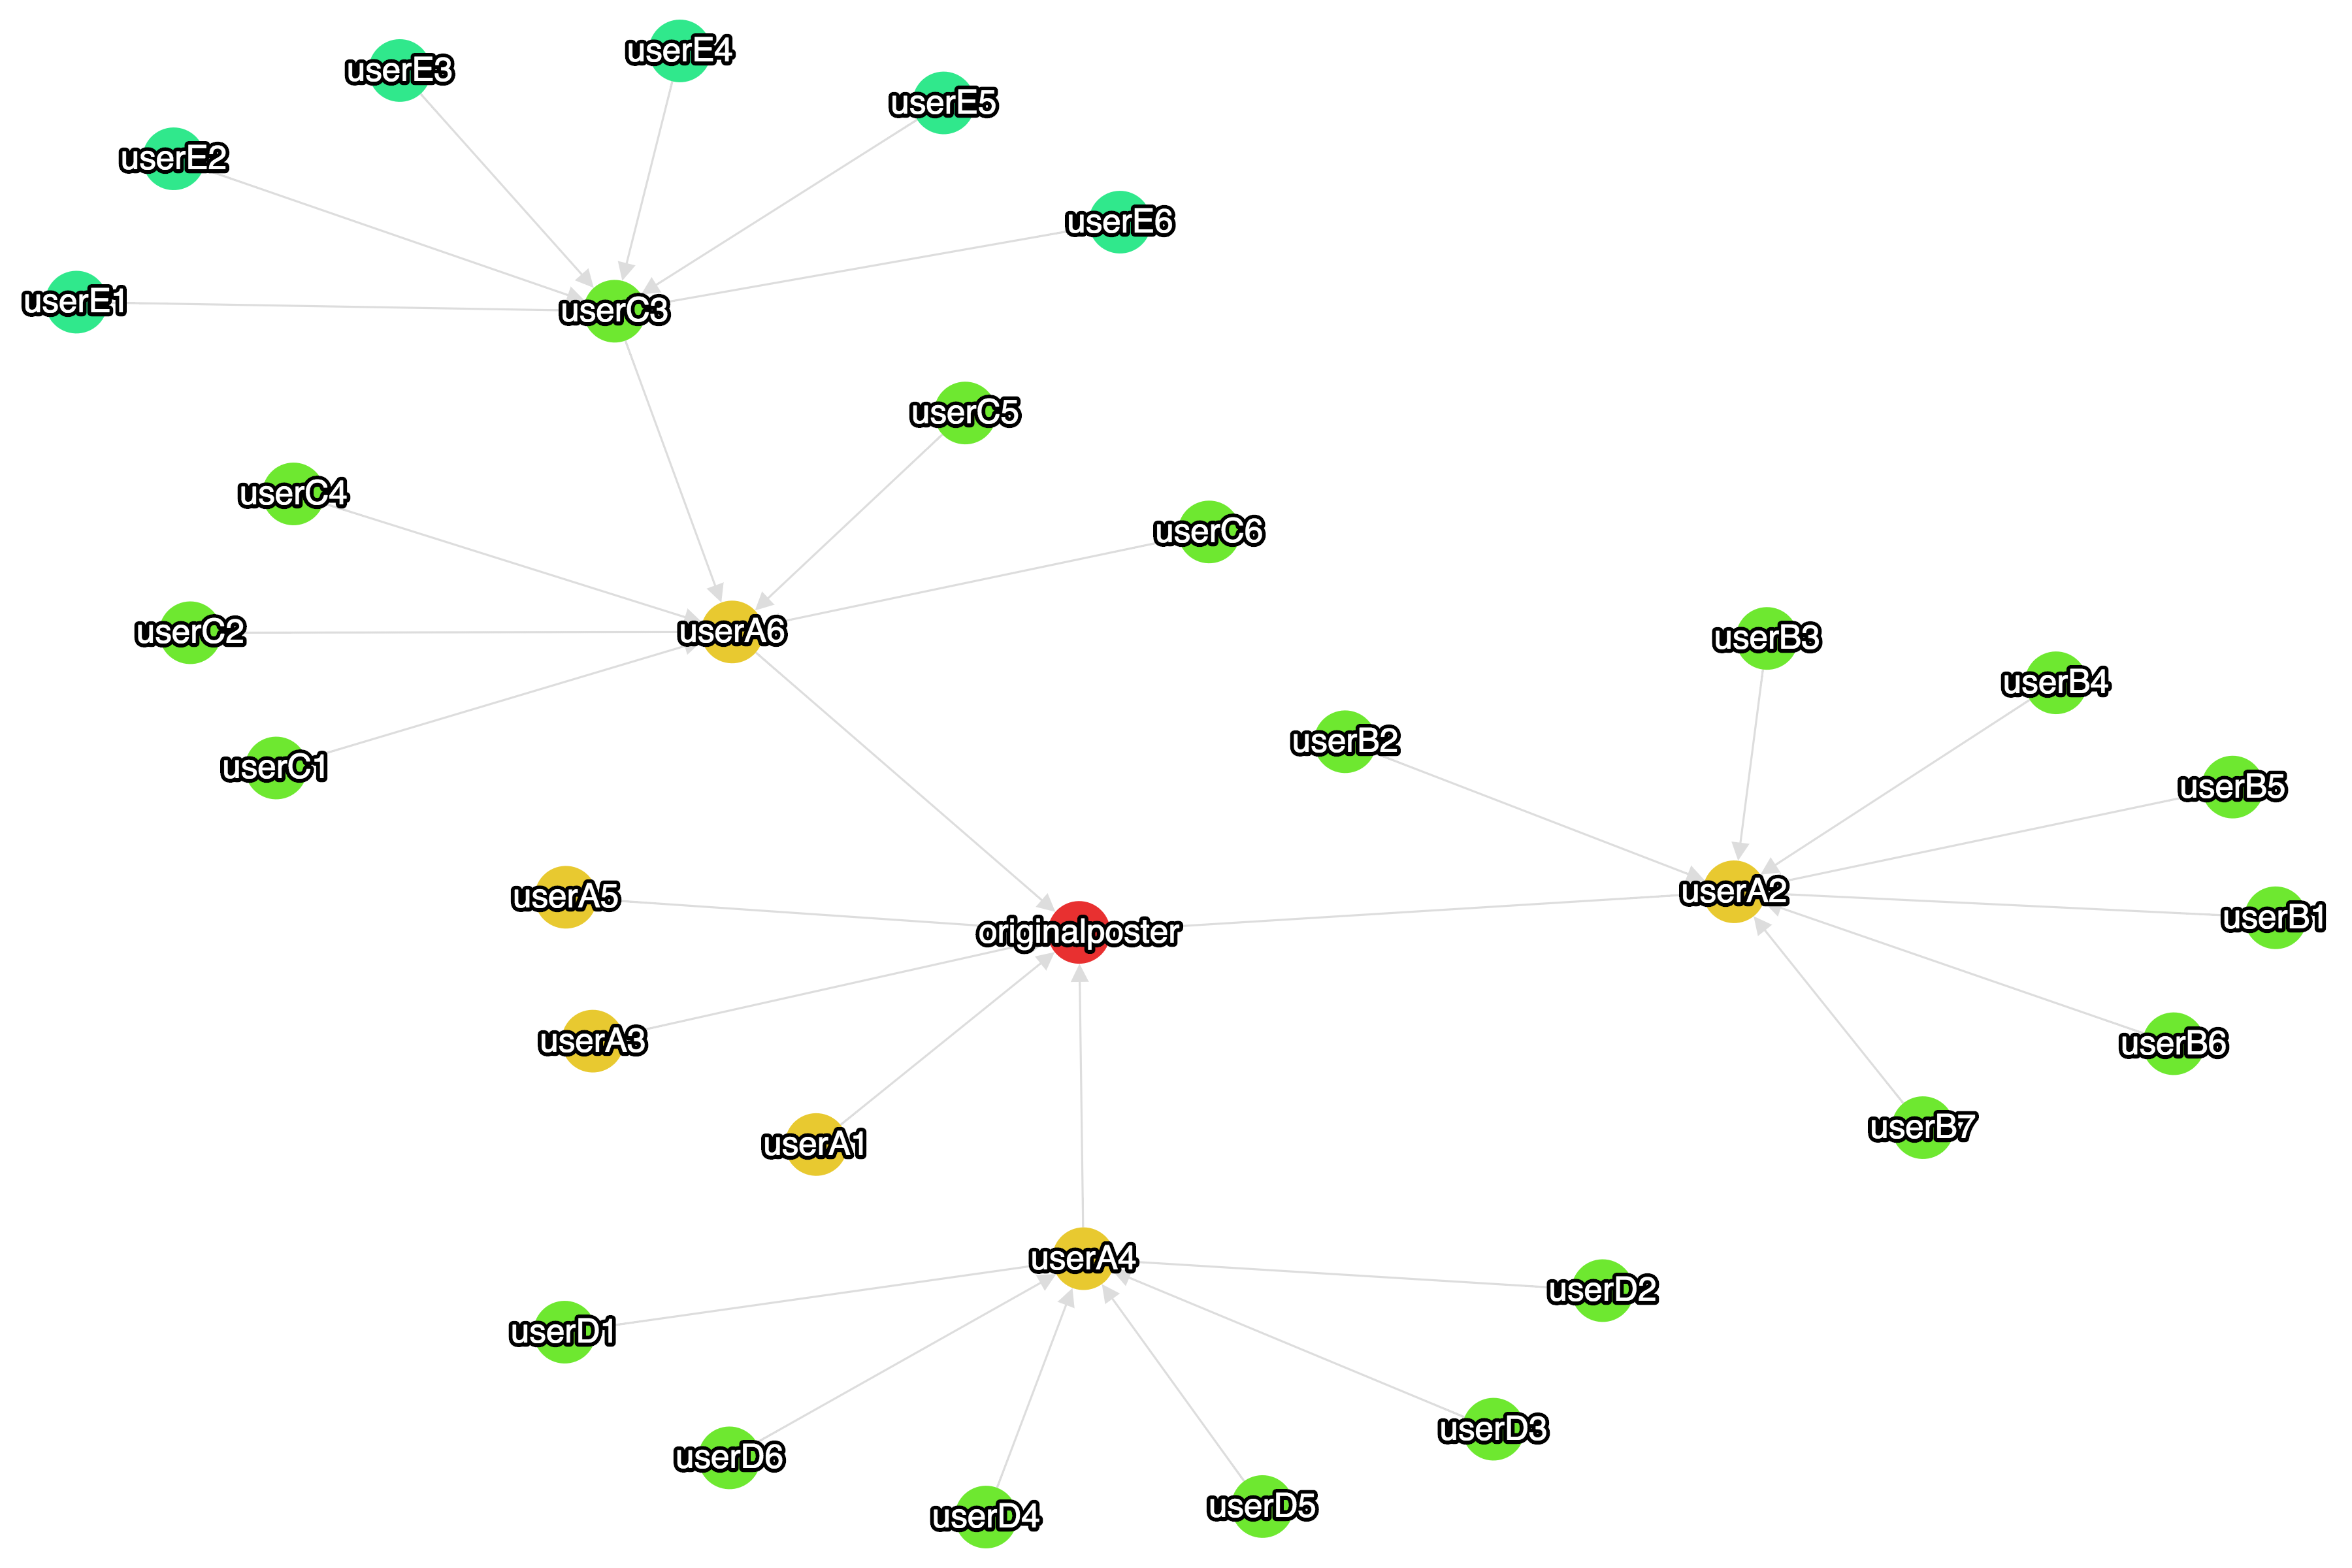
Figure 2. Same data plotted in Cytoscape.js with the springy layout.
In the new app, we enabled several different layouts similar to the Graphviz app too. In cytoscape.js, the layouts that are offered include “arbor”, “springy”, “cola”, “cose”, and “dagre”. I like “cola” because it really looks like bubbles moving around in a soda. Others are worth experimenting with too.
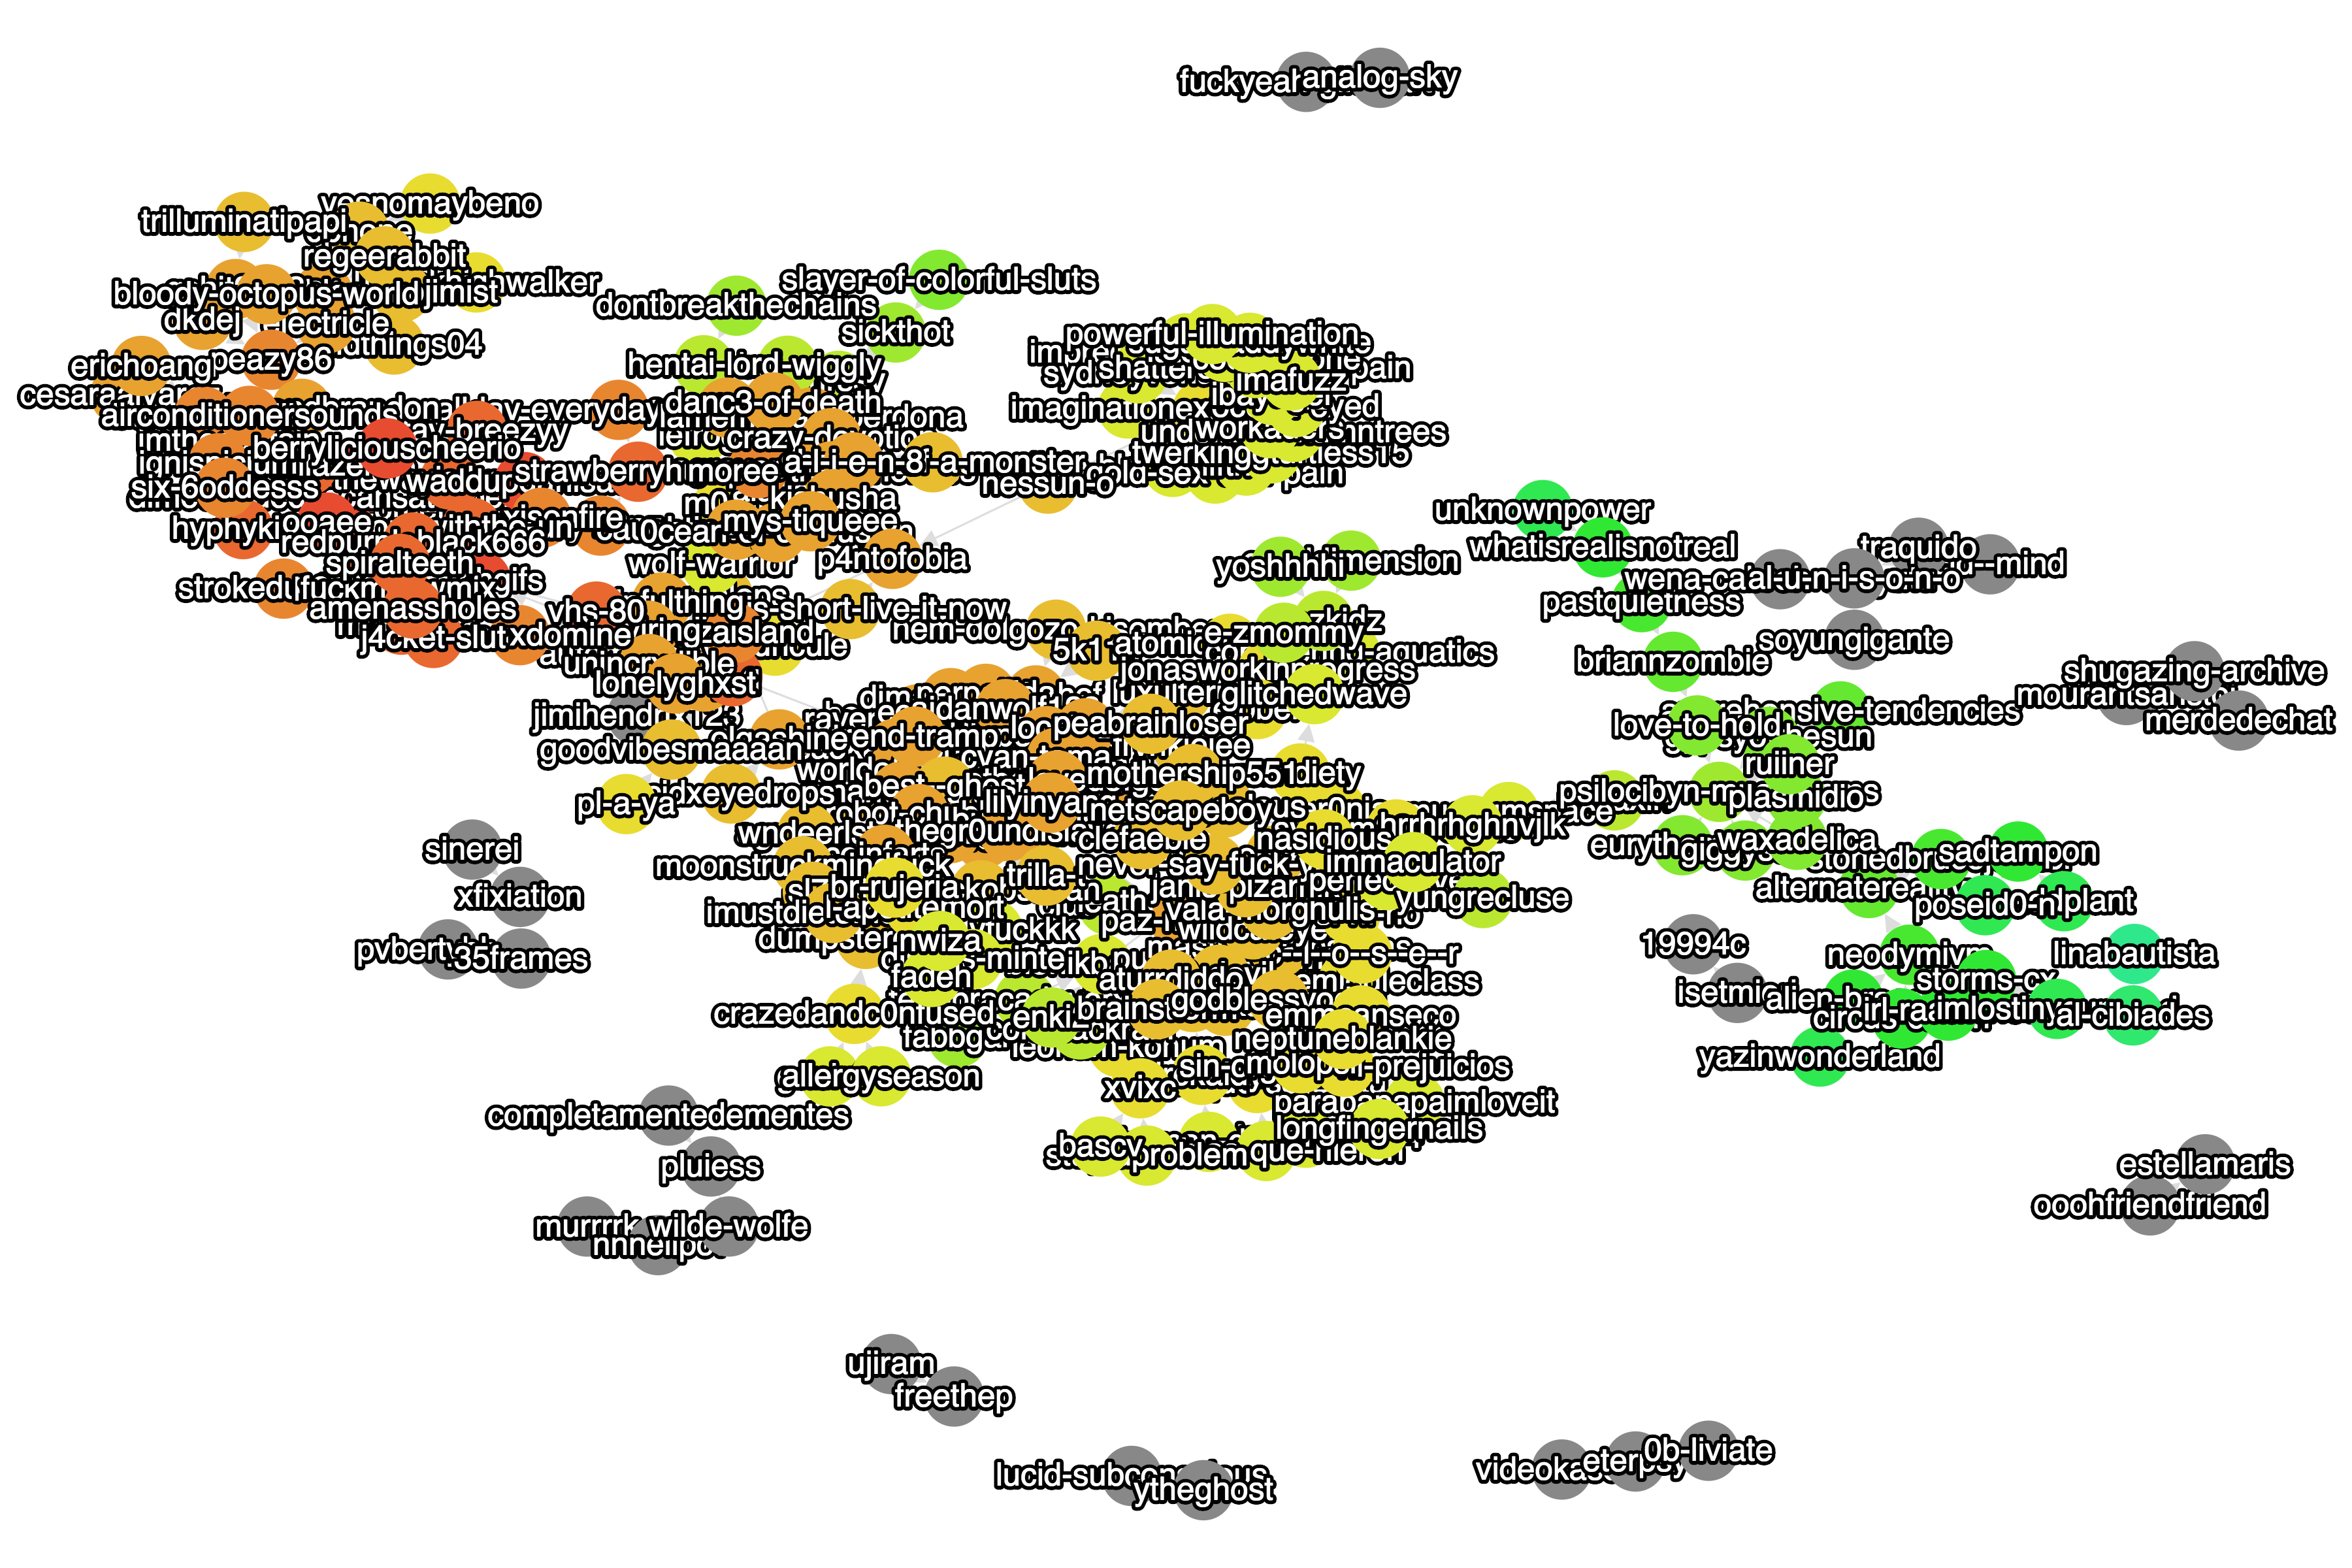
Figure 3. A Cytoscape.js springy layout for a larger tumblr reblog graph
The new cytoscape.js app also has a nice animation feature. The old graphviz app offered animation too (using Yihui’s animation library for R) but the new version can automatically encode HTML5 video on the client side from individual picture frames in the browser using “Whammy”! This is quite impressive!
So to animate the graph, what is done is
-
Add nodes/edges and layout the graph (the simulation time is configurable, because allowing the user to interact with the graph while the simulation is running is useful)
-
Once layout is complete, the user can save the graph as an animation, which first hides all nodes by adding visibility: hidden to the CSS.
-
Then the nodes are re-shown one-by-one, preserving the layout, and a frame is saved by the renderer at each step (takes a snapshot of the canvas).
This strategy for the animation is actually better than the original graphviz version that I had because the layout is only done once, which is time saving and it is also more consistent (the layout changes a lot if you re run it on different sets of nodes).
Check out the app here http://cmdcolin.github.io/tumblrgraph2/
Future goals:
- Test out super large graphs (I have tested up to about 500 reblogs but after this, around 1000 reblogs, it slows down a lot and produces bad layouts. Needs fixing)
- Test out ability to place importance on certain nodes by increasing node size based on its degree
Check out an example of the HTML5 video here