In my previous posts, I speculated about the issues that were causing server lag and CPU usage spiking with tomcat: https://cmdcolin.github.io/posts/2015-09-16
Unfortunately, I was completely wrong in my speculations, but we increased tomcat memory limits so that the entire Lucene search index could fit in memory, which was able to fix the spiky CPU problems.
Luckily, fixing the memory issues had very good implications for our webapp:
I have a cron job uses a simple curl command to grab different pages on the website, and then it logs the time taken to a output file. I charted these output times, before and after we increased the memory limits of tomcat, and it turned out that the response time of the webapp was dramatically improved by this change.
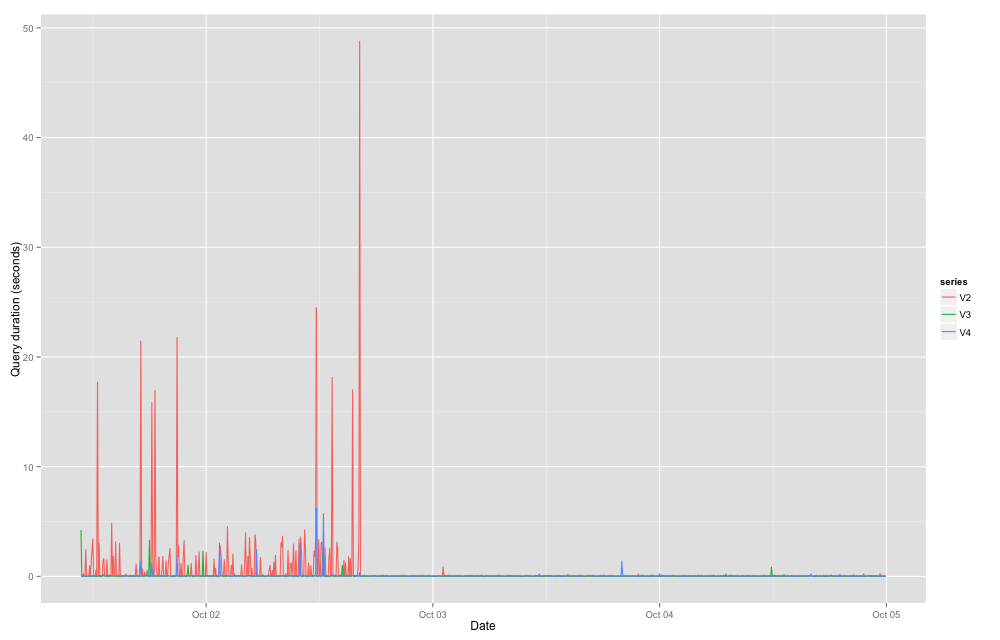
Figure 1. The webapp response time was extremely variable before the redeploy on Oct 2nd where we increased tomcat’s memory allocation, which thereafter dramatically improved the response time.
Clearly, the webapp response time was being severely compromised by the memory issues.
In response to all of these issues, I also added GC logging to the tomcat configuration so that I can see if the GC is correlated with these webapp response time. Figure 2 shows how high GC activity is correlated with longer webapp response times, but note that this figure was made after the other memory allocation problems were fixed, so it is still much better than the problems we had in the past.
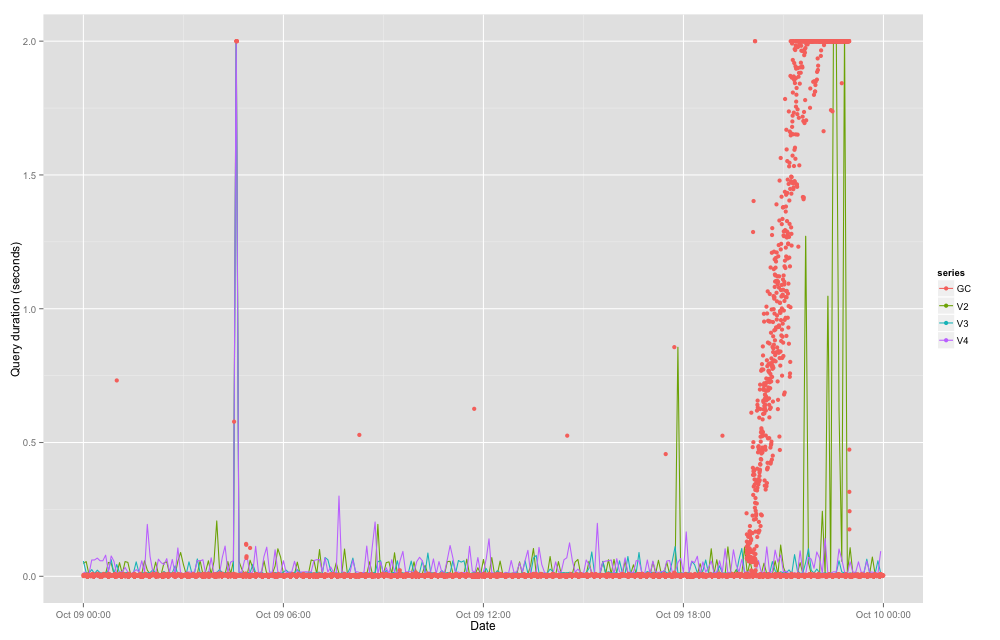
Figure 2. After increasing the memory, you can see webapp response time is much better, except if the GC activity becomes very high, and then this increases the response time.
Edit: Bonus screenshot, seemingly each friday we get a major activity burst that triggers GC activity!

Figure 3. Crazy Java GC activity on a friday night, but the app seems to recover from it
Conclusion
Increasing the memory allocation to java and tomcat allows the entire system to perform much better. If you can afford to get more memory to allocate to tomcat, then it’s probably a good idea.
Also, tracking your webapp response times will help you see if your changes are having a good effect. I made this a script for graphing log outputs here https://github.com/cmdcolin/loggraph
PS:
If your tomcat is running as the tomcat user, then it can be difficult to debug the memory problems simply with the “get heap dump” from jvisualvm, because the permissions will be wrong. To fix this, try using a privileged user to run the jmap command:
runuser -l tomcat -c "/usr/java/latest/bin/jmap-dump:format=b,file=/db/tomcat/tomcat.dump 25543"